
Gartner’s How to Achieve the Minimum Viable AI Governance


Blog
How Do You Measure Device-Based Cybersecurity ROI?

Autonomous Remediation
Configuration Drift
Endpoint Hardening
Exposure Management & CTEM
Risk Management
Security Misconfigurations
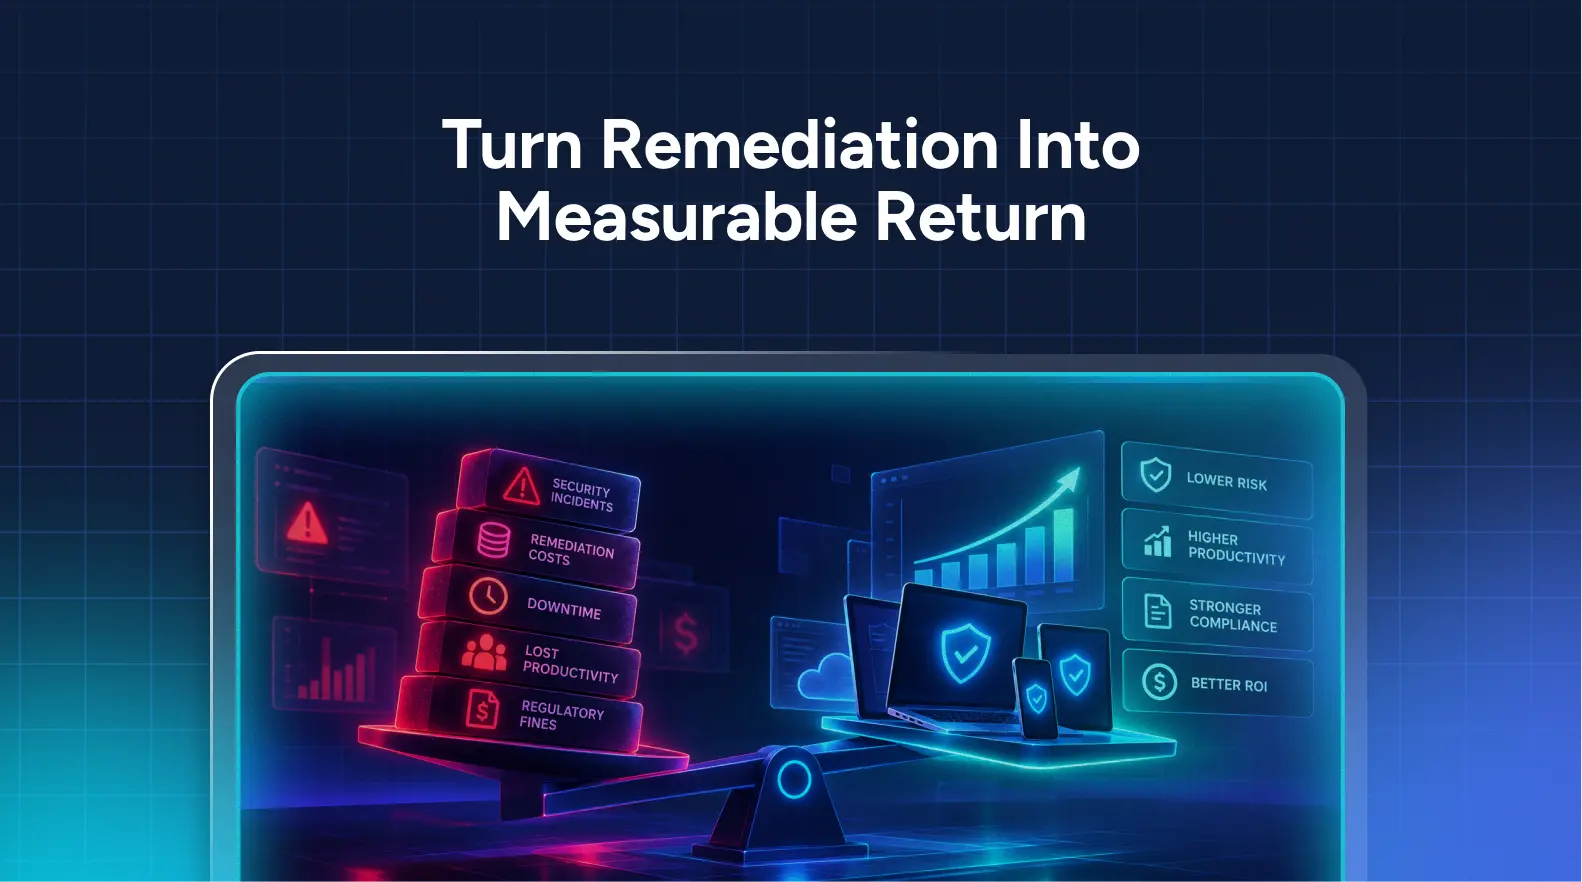
Cybersecurity ROI is often calculated against the wrong unit of work. A vulnerability scanner may identify 10,000 findings. Those findings become tickets, remediation tasks, SLA metrics, and eventually evidence that the security program is doing something about risk.
But findings processed, tickets closed, patches deployed, administrator hours saved are not necessarily good measures of exposure reduction.
It's great to show you're busy doing things, but that does not in and of itself show value.
To demonstrate cybersecurity ROI, you need to measure verified remediation. That means tracking quantifiable exposure elimination on the one hand, and your ability to do so without inviting unwanted operational impact, on the other hand. Finally, the resulting metrics must be continually reassessed to affirm that the intended state was actually achieved and remains in place.
Once remediation is viewed this way, tool cost becomes only one part of the business case. The larger cost sits in the machinery required to get from a known exposure to a durable fix – and in the exposure that remains while that machinery is working.
The Visible Costs Are the Easy Part
Vulnerability scanners, endpoint tools, compliance platforms, patching infrastructure, configuration management systems, and security headcount are easy to find in a budget. But remediation costs are more dispersed.
A finding might first be triaged by Security and then assigned to Infrastructure. An engineer investigates the affected systems and determines whether the recommended change is appropriate. Application owners may need to be consulted.
The change is tested, scheduled, deployed, and checked. Failed deployments generate troubleshooting. Successful deployments can still create support incidents. A configuration may later drift and require the same work again. When an auditor asks for evidence, another team may have to prove that the change reached the intended systems.
None of this is unusual. It is simply spread across enough teams and systems that organizations rarely see it as one cost.
A Finding Is Not a Unit of Remediation
Finding counts are particularly poor inputs for ROI calculations. If an assessment identifies 10,000 findings, the organization does not necessarily have 10,000 independent problems requiring 10,000 independent fixes.
One insecure configuration could exist on 4,000 endpoints. Several findings might have the same underlying cause. At the other extreme, a single recommended remediation may require different treatments because the affected population contains different operating systems, applications, dependencies, business functions, or compensating controls.

This is where finding counts begin to diverge from actual remediation effort. Before making a change, teams need to establish which systems are affected, whether the same correction is appropriate across that population, and what could break if the change is made. Afterward, they still need to determine whether the intended endpoint state was achieved.
A raw finding count captures none of this. Which is why mature operators instead look to measure the cost of achieving a verified remediation.
That means looking at the total effort spent on remediation relative to the exposures that were durably closed.
A deployment that succeeds on 85% of its target population is not economically equivalent to one that succeeds on 99%. A fix that is overwritten a week later by GPO, Intune, an application installer, an administrator, or another configuration authority also has a different economic profile from one that persists.
The organization paid for all of that activity. Only some of it resulted in durable exposure reduction.
Real-world vulnerability data shows how significant the gap can become. Verizon's 2026 Data Breach Investigations Report analyzed aggregated vulnerability data from more than 13,000 organizations and found that only 26% of Known Exploited Vulnerabilities were fully remediated across detected instances.
Detection, ticket creation, partial remediation, and complete closure are all vastly different states. ROI calculations should treat them as such.
The Labor Cost Is Larger Than the Remediation Task
Finding volume alone is a poor predictor of remediation cost.
Consider an environment with 10,000 device findings requiring action. Some may collapse into a relatively small number of common remediation actions. Others may need separate treatment because of application dependencies, device roles, operating-system differences, business criticality, or existing compensating controls.
The labor cost sits around the remediation as much as in the change itself. Security engineers determine what needs to change and which systems are affected. Endpoint or infrastructure teams determine how the change can be implemented. Application owners may need to validate dependencies. Changes may require testing, coordination, phased deployment, exception handling, and post-change validation. Failed changes and configuration drift add further work.
A more defensible cost model measures that effort at the remediation-campaign level.
Suppose an organization handles 250 distinct remediation campaigns in a year. Across investigation, change design, testing, coordination, deployment, exception handling, and validation, assume each campaign consumes an average of 20 aggregate staff hours. That is 5,000 hours of remediation work annually.
At a blended labor cost of $75 per hour, the direct labor cost is $375,000 per year.
Now assume that failed changes, endpoint exceptions, incomplete deployments, or recurring configuration drift generate another 20% in remediation effort. That adds 1,000 hours, bringing the annual workload to 6,000 hours and the direct labor cost to $450,000.
Configuration drift is particularly important because it can turn completed remediation back into active workload. A setting changed by an administrator, software update, GPO, Intune policy, script, or another configuration authority may recreate an exposure that the organization has already paid to remediate. The cost is not limited to making the correction again. Depending on the operating model, the issue may also have to be rediscovered, investigated, reassigned, validated, and documented again.
If automation reduces average campaign effort from 20 aggregate staff hours to 10 while also reducing rework and recurrence from 20% to 5%, annual remediation effort falls from 6,000 hours to 2,625. At the same $75 blended labor rate, direct labor cost falls from $450,000 to approximately $197,000 – about $253,000 in annual labor capacity recovered.
This is a more useful way to think about remediation automation. The economic benefit comes from reducing the human effort required to achieve and maintain the intended security state, including work that would otherwise recur after a supposedly completed remediation.
Exposure Duration Belongs in the Calculation
Labor captures only part of the cost. The exposure continues to exist while teams triage tickets, test changes, obtain approvals, wait for maintenance windows, deploy fixes, and validate the result.
MTTR captures some of this, although an average can obscure what is happening across a large device population.
Consider an exposure affecting 10,000 devices. If those devices remain exposed for an average of 30 days, the organization accumulates 300,000 device-days of exposure. Reducing the average to three days brings that figure down to 30,000.
That is 270,000 device-days of exposure eliminated.
This gives remediation velocity a more useful denominator than ticket age alone. It captures both the size of the affected population and how long the condition persists. It does not, however, mean that every device-day carries the same risk or the same financial value.
A day of exposure on a standard employee workstation is economically different from a day on a privileged administrator workstation, an internet-facing server, or a system supporting a critical business process. Organizations that want to bring exposure duration into the financial model should therefore segment the affected population according to security and business impact.
A practical model might look like this:
The objective is not to assign an arbitrary dollar value to every device-day. Cyber risk does not behave that linearly.
Ten days of exposure do not necessarily create ten times the expected loss of one day, and 1,000 affected devices do not automatically create 1,000 times the risk of a single device. Exploitability, privilege, reachability, shared attack paths, compensating controls, and the business consequence of compromise all change the calculation.
For material exposures, the stronger approach is to model the financial effect of shortening the exposure window using expected loss.
Suppose 500 of the affected devices belong to a high-impact population. The organization's existing risk model estimates that leaving a particular exposure unresolved for 30 days creates a 2% probability of a material event with an estimated $2 million impact. That produces an expected loss of $40,000 for the scenario.
If reducing the remediation window to three days lowers the organization's modeled probability to 0.4%, expected loss falls to $8,000. The modeled economic benefit associated with the shorter exposure window is $32,000.
Those probabilities cannot be inferred from remediation time alone. They need to come from the organization's own risk analysis, informed by factors such as exploit availability, asset criticality, threat activity, exposure, existing controls, and historical incident data. The calculation is only as defensible as those inputs.
For organizations without that level of cyber-risk quantification, device-days still provide a useful operational measure. They show whether remediation is reducing the scale and duration of unresolved exposure without pretending to know its precise financial consequence.
There is no universal exchange rate between exposure time and dollars. Device-days measure the exposure window; business and cyber-risk context determine what that exposure is worth.
Faster Remediation Only Matters if It Works
Reducing remediation time can produce an impressive operational metric while leaving a significant portion of the affected population exposed.
A patch or configuration change may fail on some endpoints. Devices may be offline. A prerequisite may be missing. An application dependency may prevent the recommended change. A conflicting management policy may restore the previous state after the remediation succeeds.
Those conditions are common enough that deployment completion should not be treated as proof of remediation. A deployment can complete successfully while leaving part of the affected population exposed.
Devices may be offline, prerequisites may be missing, application dependencies may prevent the change, or another configuration authority may interfere with the resulting state. The economically relevant measure is therefore not whether the remediation was executed, but how much of the intended population actually reached the desired state.
Similarly, executing a patch or configuration change does not by itself establish that the exposure has been removed across the intended population. Teams may still need to reconcile deployment results, investigate exceptions, confirm endpoint state, and produce evidence for internal governance or audit requirements.
Where that evidence has to be assembled manually across multiple systems, remediation continues consuming staff time after the change itself is complete. And that's when the verification succeeds. When the desired state is not found to be in place, a lengthier and costlier process begins.
The value of faster delivery is eroded when changes create additional corrective work. That makes remediation success a key part of the ROI calculation rather than an implementation detail.
It's why DORA considers change failure and deployment rework alongside throughput when gauging performance.
This becomes particularly important as remediation is more automated. A process that reaches thousands of devices quickly but generates exceptions, failed changes, and follow-up work may look efficient from the deployment system while remaining expensive for the teams responsible for cleaning up behind it.
A hardening action can disrupt an application dependency. A patch can create compatibility problems. A configuration change can conflict with another management authority.
At enterprise scale, even a relatively low failure rate can create significant operational work. Which is why dependency awareness, pre-execution validation, controlled rollout, post-execution verification, and rollback affect the economic case for automation.
Automation that only accelerates execution solves a narrower problem than automation that can safely close exposure. The trick is in automating durable remediation without transferring the cost into outages, exceptions, troubleshooting, and recovery.
Remediation Capacity Is the Larger Business Case
There is another cost that is difficult to see in a remediation budget: the work that skilled teams are not doing.
Time spent investigating repetitive findings, coordinating routine changes, verifying endpoint state, and correcting recurring drift cannot be spent on architecture, cloud migration, identity modernization, incident readiness, or other work that requires engineering judgment.
That capacity becomes increasingly important as remediation demand grows. Verizon's 2026 analysis found the median number of CISA KEVs organizations were addressing rose from 11 to 16 while median time to full remediation increased to 43 days.
Adding people can increase throughput, but it leaves the underlying relationship between exposure volume and human effort largely intact. Every additional wave of findings creates another wave of investigation, coordination, execution, and verification.
A more scalable model changes how much of that work requires human intervention in the first place. Repeatable investigation, validation, remediation, and enforcement can be handled without adding equivalent operational effort each time the exposure volume increases.
This is where the ROI case becomes more consequential than administrator productivity. The organization is changing how remediation capacity scales.
Measuring What Isn't There
In addition to remediation labor saving, rework avoided, effort saved in evidence collection, you also need to account for the financial value of reduced exposure.
Labor savings can be directly observed. Avoided breach loss cannot. It depends on assumptions about the probability of an event, the importance of the affected systems, and the financial consequences if the exposure is exploited. It belongs in the analysis, but it should be presented as risk reduction rather than booked savings.
The magnitude of that risk explains why it matters. IBM's 2026 Cost of a Data Breach Report puts the global average cost of a data breach at $4.99 million.
That does not mean remediating a vulnerability creates $4.99 million in value. Applying the average breach cost to every remediation would produce a meaningless ROI figure. It does establish that the duration and scale of material exposure have an economic dimension that a labor-only calculation misses.
Now consider a hypothetical enterprise with 25,000 endpoints and 50,000 actionable device-security exposures during a year. Those exposures do not necessarily represent 50,000 independent remediation tasks. Assume they result in 500 distinct remediation campaigns across configuration changes, vulnerability remediation, patching, and other device-security work.
If investigation, remediation design, testing, coordination, deployment, exception handling, and validation consume an average of 20 aggregate staff hours per campaign, the organization spends approximately 10,000 staff hours on remediation annually. At a blended labor cost of $75 per hour, that represents $750,000 in direct remediation labor.
If failed changes, exceptions, incomplete deployments, recurring exposures, and configuration drift add another 20% to the annual workload, remediation consumes another 2,000 staff hours, bringing direct labor cost to approximately $900,000 per year.
These figures are illustrative rather than industry benchmarks. The useful calculation is not the assumed dollar amount, but the structure of the model. Organizations can replace the assumptions with their own remediation volume, aggregate staff effort, rework rate, and labor costs.
Even then, direct labor captures only part of the economic burden. It does not account for the financial effect of leaving exposures unresolved while remediation is underway or the operational cost of a remediation that causes disruption.
The difficult part is not producing the arithmetic. It is replacing assumptions with measurements from the operating environment.
Moving From Estimated ROI to Evidence
ROI calculations created during procurement are necessarily predictive. They use assumptions about how many hours will be saved, how much remediation can be automated, and what those efficiencies are worth.
Once the platform is operating, some of those assumptions can be tested.
Remedio includes a built-in ROI Calculator that tracks time saved across remediation, compliance enforcement, and operational work and translates those savings into dollar value using FTE cost estimates. This provides an ongoing measure of realized operational efficiency rather than leaving the business case in the spreadsheet used to justify the original purchase.
If a remediation workflow previously required 45 minutes of human effort and now requires five, the meaningful evidence is the aggregate time avoided across the environment and the corresponding labor value.
The same principle applies to work that disappears altogether. If continuous enforcement prevents a configuration from drifting back into an insecure state, the organization avoids another round of detection, triage, assignment, remediation, and validation. Those avoided cycles contribute to the economic return even though no new remediation ticket exists to count them.
Remedio translates that day-to-day security work into operational and financial measures that can be used outside the security team. Their ROI Calculator should be paired with field-validated operational measures to show how those efficiencies are producing better security outcomes.
The exact metrics will vary by organization, but several are particularly revealing:
The Economic Outcome Is Exposure Removed
Security programs already produce abundant evidence of activity. Vulnerabilities discovered, alerts generated, tickets created, patches deployed, and configurations changed are all easy to count.
Complete remediation is harder.
Remedio is designed around that gap. It identifies vulnerable and misconfigured device states, accounts for dependencies before remediation, executes corrections, validates the resulting state, supports rollback where necessary, and continues monitoring for drift. The built-in ROI Calculator adds visibility into the time and FTE-cost savings associated with that work.
For the business case, those measures belong together. Lower remediation cost without meaningful exposure reduction is an efficiency story, not a security outcome. Exposure reduction that depends on ever-increasing amounts of manual work will eventually run into a capacity ceiling.
The more durable measure of device-security ROI is how much verified exposure the organization can remove, how long that exposure remains open, what it costs to close it, and how often the same work has to be done again.


FAQ
How should security teams establish a baseline before calculating remediation ROI?
Start with the operating model that exists today, not the expected benefits of automation. Measure aggregate human effort per remediation campaign, time from detection to verified closure, the percentage of targeted devices that actually reach the intended state, rework caused by failed or incomplete changes, recurrence after remediation, and the amount of effort required to prove closure.
That baseline creates the counterfactual against which improvement can be measured. Without it, an organization may be able to show that remediation became faster after a technology change, but not whether it became economically more efficient.
That baseline creates the counterfactual against which improvement can be measured. Without it, an organization may be able to show that remediation became faster after a technology change, but not whether it became economically more efficient.
Should every cybersecurity exposure be assigned a dollar value?
No. Forcing every exposure into a monetary estimate can create false precision. Lower-impact exposures may be adequately represented through operational measures such as device-days of exposure, remediation effort, recurrence, and time to verified closure.
Financial modeling becomes more useful as business impact becomes material. For privileged endpoints, internet-facing systems, critical business services, or sensitive-data environments, organizations can incorporate asset criticality, exploitability, access, threat likelihood, existing controls, and expected business impact into the calculation.
Financial modeling becomes more useful as business impact becomes material. For privileged endpoints, internet-facing systems, critical business services, or sensitive-data environments, organizations can incorporate asset criticality, exploitability, access, threat likelihood, existing controls, and expected business impact into the calculation.
How should remediation ROI account for exposures that return after they are fixed?
Treat recurrence as new economic work rather than assuming the original remediation remains permanently valuable. A configuration that drifts back, a patch that is superseded by an incompatible state, or a control that is overwritten creates another cycle of detection, investigation, remediation, validation, and evidence collection.
This makes recurrence rate an important ROI variable. Two remediation approaches may have similar initial success rates but very different economics if one produces substantially more durable outcomes.
This makes recurrence rate an important ROI variable. Two remediation approaches may have similar initial success rates but very different economics if one produces substantially more durable outcomes.
How can organizations compare manual remediation with automated remediation fairly?
Compare the complete remediation lifecycle rather than the execution step alone. Manual and automated approaches should be evaluated against the same measures: aggregate staff effort, time to verified closure, successful coverage of the targeted population, change-failure rate, rework, recurrence, assurance overhead, and exposure duration.
Automation that deploys changes quickly but generates exceptions, failed changes, or extensive manual verification may simply move labor downstream. The economic advantage appears when automation reduces the total work required to achieve and maintain a verified security state.
Automation that deploys changes quickly but generates exceptions, failed changes, or extensive manual verification may simply move labor downstream. The economic advantage appears when automation reduces the total work required to achieve and maintain a verified security state.
What is the difference between remediation efficiency and remediation effectiveness?
Efficiency measures the resources consumed to close exposure. Effectiveness measures whether the exposure was actually closed across the intended population and remained closed.
The distinction matters because a process can become operationally faster without becoming materially better at reducing risk. A lower cost per attempted change is valuable only when the resulting state is verified and durable.
The distinction matters because a process can become operationally faster without becoming materially better at reducing risk. A lower cost per attempted change is valuable only when the resulting state is verified and durable.
How should CISOs present remediation ROI to finance or executive leadership?
Translate security activity into capacity, cost, and exposure outcomes. Measures such as analyst hours saved, cost per verified remediation, avoided rework, reduced device-days of exposure, and additional remediation capacity are easier to defend than vulnerability counts or patches deployed.
Where credible cyber-risk quantification exists, material exposures can also be connected to expected financial loss. The objective is not to claim that every remediated vulnerability prevented a breach. It is to show, with evidence, how the investment changes the cost and scale of remediation and the duration of economically meaningful exposure.
Where credible cyber-risk quantification exists, material exposures can also be connected to expected financial loss. The objective is not to claim that every remediated vulnerability prevented a breach. It is to show, with evidence, how the investment changes the cost and scale of remediation and the duration of economically meaningful exposure.
When should an organization recalculate its cybersecurity remediation ROI?
ROI should move from a procurement assumption to an operating metric once sufficient production data exists. Recalculate it when remediation volume, labor costs, automation coverage, endpoint population, failure rates, recurrence, or the organization’s risk profile changes materially.
A static annual ROI calculation can hide deterioration in the underlying process. Continuous or periodic measurement shows whether improvements are compounding as remediation scales or whether new operational friction is consuming the expected return.
A static annual ROI calculation can hide deterioration in the underlying process. Continuous or periodic measurement shows whether improvements are compounding as remediation scales or whether new operational friction is consuming the expected return.
About Author

CVE-2026-81983: Integer Overflow Vulnerability Enables Out-of-Bounds Write in Adobe Acrobat
A single 32-bit multiplication is enough to turn a malicious PDF into memory...